Proxy LLM Calls
Agenta provides a proxy service that allows you to invoke your deployed prompts while automatically capturing metrics, traces, and logs. This gives you full observability into your LLM application's performance, costs, and behavior in production.
Accessing the Proxy Endpoint
You can find the specific endpoint information to invoke your deployed prompt directly within the Agenta UI:
- Navigate to "Deployments"
- Click on your deployed environment
- Look for the "API" button in the top-right corner
Making a Proxy Call
You can invoke your deployed prompt using REST API.
Here's how to call your deployed prompt using Python with the requests library:
import os
import requests
import json

# Endpoint for the proxy service
url = "https://cloud.agenta.ai/services/completion/run"

# Parameters specifying the environment, application, and input variables
params = {
  "environment": "development",  # The environment (production, development, staging)
  "app": "classification",       # Your application name
  "inputs": {
    "country": "France"          # Input variables required by your prompt
  }
}

# Required headers including your API key
headers = {
    "Content-Type": "application/json",
    "Authorization": f"ApiKey {os.environ['AGENTA_API_KEY']}",
}

# Make the request
response = requests.post(url, json=params, headers=headers)

# Parse and display the response
data = response.json()
print(json.dumps(data, indent=4))
Understanding the Response
The proxy service returns a structured response with the following fields:
{
    "version": "3.0",                                     // SDK version
    "data": "The capital of France is Paris.",            // LLM output
    "content_type": "text/plain",                         // Output format (text/plain or application/json)
    "tree_id": "0ef1d6b7-84c3-4b8a-705b-ae5974e51954"    // Tree ID for observability
}
The tree_id can be used to locate this specific request in the observability dashboard.
Viewing Traces in the Observability Dashboard
All proxy calls are automatically traced and can be viewed in the observability dashboard:
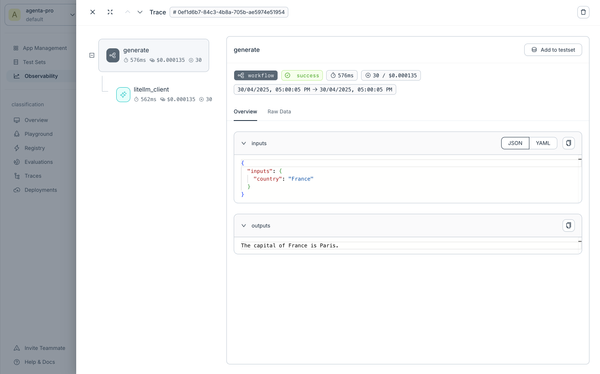
The dashboard provides comprehensive insights into your LLM application's behavior, including:
- Complete prompt and response content
- Input and output token counts
- Request duration
- Model parameters used
- Associated costs