Overview
Observability is the practice of monitoring and understanding the behavior of your LLM application. With Agenta, you can add a few lines of code to start tracking all inputs, outputs, and metadata of your application.
This allows you to:
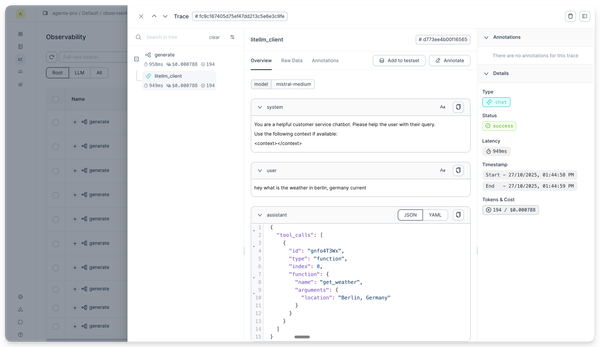
- Debug Effectively: View exact prompts sent and contexts retrieved. For complex workflows like agents, you can trace the data flow and quickly identify root causes.
- Bootstrap Test Sets: Track real-world inputs and outputs and use them to bootstrap test sets in which you can continuously iterate.
- Find Edge Cases: Identify latency spikes and cost increases. Understand performance bottlenecks to optimize your app's speed and cost-effectiveness.
- Track Costs and Latency Over Time: Monitor how your app's expenses and response times change.
- Compare App Versions: Compare the behavior in production of different versions of your application to see which performs better.
Observability in Agenta
Agenta's observability features are built on OpenTelemetry (OTel), an open-source standard for application observability. This provides several advantages:
- Wide Library Support: Use many supported libraries right out of the box.
- Vendor Neutrality: Send your traces to platforms like New Relic or Datadog without code changes. Switch vendors at will.
- Proven Reliability: Use a mature and actively maintained SDK that's trusted in the industry.
- Ease of Integration: If you're familiar with OTel, you already know how to instrument your app with Agenta. No new concepts or syntax to learn—Agenta uses familiar OTel concepts like traces and spans.