Quick Start: OpenTelemetry for JavaScript/TypeScript (Node.js)
Agenta captures all inputs, outputs, and metadata from your LLM applications using OpenTelemetry. This guide shows you how to instrument a Node.js application with OpenTelemetry and send traces to Agenta.
Step-by-Step Guide
1. Install Required Packages
Install OpenTelemetry packages, OpenAI, and the OpenInference instrumentation for OpenAI:
npm install @opentelemetry/api \
  @opentelemetry/sdk-trace-node \
  @opentelemetry/exporter-trace-otlp-proto \
  @opentelemetry/instrumentation \
  @opentelemetry/resources \
  @opentelemetry/semantic-conventions \
  @arizeai/openinference-instrumentation-openai \
  @arizeai/openinference-semantic-conventions \
  openai
2. Configure Environment Variables
You need an API key to start tracing your application. Visit the Agenta API Keys page under settings and create a new API key.
export AGENTA_API_KEY="YOUR_AGENTA_API_KEY"
export AGENTA_HOST="https://cloud.agenta.ai"  # Change for self-hosted
export OPENAI_API_KEY="YOUR_OPENAI_API_KEY"
3. Set Up Instrumentation
Create an instrumentation.js file to configure OpenTelemetry:
// instrumentation.js
import { registerInstrumentations } from "@opentelemetry/instrumentation";
import { OpenAIInstrumentation } from "@arizeai/openinference-instrumentation-openai";
import { OTLPTraceExporter } from "@opentelemetry/exporter-trace-otlp-proto";
import { NodeTracerProvider } from "@opentelemetry/sdk-trace-node";
import { Resource } from "@opentelemetry/resources";
import { SimpleSpanProcessor } from "@opentelemetry/sdk-trace-base";
import { ATTR_SERVICE_NAME } from "@opentelemetry/semantic-conventions";
import OpenAI from "openai";

// Configure the OTLP exporter to send traces to Agenta
const otlpExporter = new OTLPTraceExporter({
  url: `${process.env.AGENTA_HOST}/api/otlp/v1/traces`,
  headers: {
    Authorization: `ApiKey ${process.env.AGENTA_API_KEY}`,
  },
});

// Create and configure the tracer provider
const tracerProvider = new NodeTracerProvider({
  resource: new Resource({
    [ATTR_SERVICE_NAME]: "openai-quickstart",
  }),
});

// Use SimpleSpanProcessor for immediate export (better for short scripts)
// For long-running services, use BatchSpanProcessor for better performance
tracerProvider.addSpanProcessor(new SimpleSpanProcessor(otlpExporter));
tracerProvider.register();

// Register OpenAI instrumentation
const instrumentation = new OpenAIInstrumentation();
instrumentation.manuallyInstrument(OpenAI);

registerInstrumentations({
  instrumentations: [instrumentation],
});

console.log("👀 OpenTelemetry instrumentation initialized");
4. Instrument Your Application
Create your application file app.js:
// app.js
import OpenAI from "openai";
import { trace } from "@opentelemetry/api";

const openai = new OpenAI({
  apiKey: process.env.OPENAI_API_KEY,
});

const tracer = trace.getTracer("my-app", "1.0.0");

async function generate() {
  // Create a span using Agenta's semantic conventions
  return tracer.startActiveSpan("generate", async (span) => {
    try {
      // Set span type
      span.setAttribute("ag.type.node", "workflow");

      const messages = [
        { role: "system", content: "You are a helpful assistant." },
        { role: "user", content: "Write a short story about AI Engineering." },
      ];

      // Set inputs
      span.setAttribute("ag.data.inputs", JSON.stringify({
        messages: messages,
        model: "gpt-3.5-turbo"
      }));

      const response = await openai.chat.completions.create({
        model: "gpt-3.5-turbo",
        messages: messages,
      });

      const content = response.choices[0].message.content;

      // Set outputs
      span.setAttribute("ag.data.outputs", JSON.stringify({
        content: content
      }));

      return content;
    } finally {
      span.end();
    }
  });
}

async function main() {
  const result = await generate();
  console.log(result);

  // Flush traces before exit
  await trace.getTracerProvider().forceFlush();
}

main();
5. Run Your Application
Run your application with the instrumentation loaded first:
node --import ./instrumentation.js app.js
Or add it to your package.json:
{
  "type": "module",
  "scripts": {
    "start": "node --import ./instrumentation.js app.js"
  }
}
Then run:
npm start
How It Works
The instrumentation uses two mechanisms to trace your application:
-
Auto-instrumentation:
OpenAIInstrumentationautomatically captures all OpenAI API calls, including prompts, completions, tokens, and costs. -
Manual spans: You can create custom spans using
tracer.startActiveSpan()to track your own functions and add metadata using Agenta's semantic conventions.
This guide uses SimpleSpanProcessor which sends spans immediately. This is ideal for:
- Short-lived scripts and CLI tools
- Development and debugging
- Ensuring traces are captured before process exit
For long-running services (web servers, background workers), use BatchSpanProcessor for better performance by batching multiple spans before sending.
Agenta Semantic Conventions
The example uses Agenta's semantic conventions for proper trace display:
ag.type.node- Defines the operation type (workflow, task, tool, etc.)ag.data.inputs- Stores input parameters as JSONag.data.outputs- Stores output results as JSONag.data.internals- Stores intermediate values and metadata (optional)
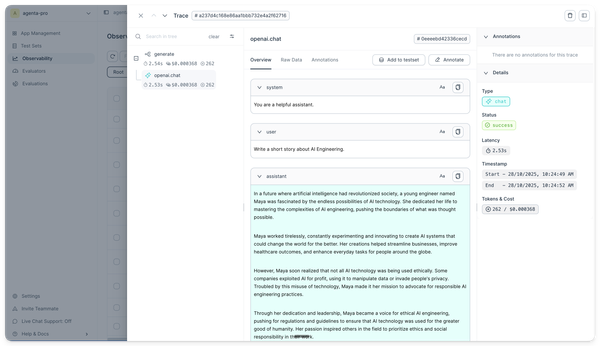
View Traces in the Agenta UI
After running your application, log in to your Agenta dashboard and navigate to the Observability section. You will see traces showing:
- Complete execution timeline
- Input messages and parameters
- Output content
- Token usage and costs
- Latency metrics
Next Steps
- Learn about semantic conventions for better trace formatting
- Explore distributed tracing across services
- See integration examples for other frameworks